Market research: what it is, how to do it in 6 steps and a free template (PDF)
What to ask, where to find free data and how to draw conclusions, with a template to fill in

What to ask, where to find free data and how to draw conclusions, with a template to fill in
Do you know how many people really want what you sell? And how much would they pay for it?
Market research is the way to answer those questions with data, before you invest.
You gather information about your customers, your competitors and your industry, analyze it and make decisions based on it.
You don’t need an agency or a big budget.
A small business can carry out useful market research in two or three weeks with free sources and an email survey of its own customers.
In this guide you’ll find the 6 steps, a complete example for a small business, the free sources you can use and a PDF template to fill in your own.
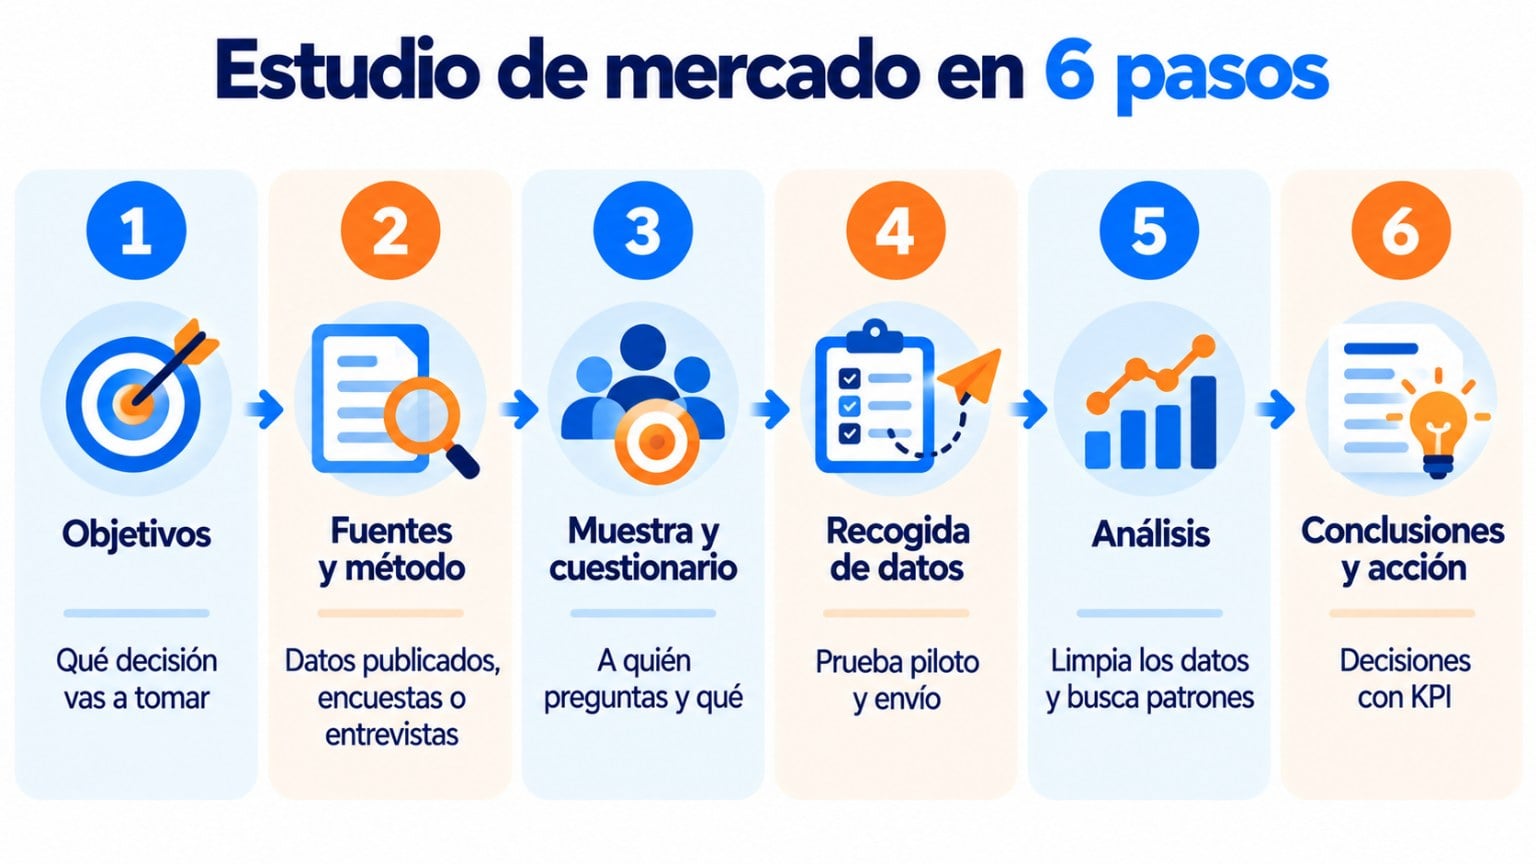
Here’s the summary. Further down you’ll find each step explained and a real example of how to apply them.
| Step | What you do | What you get |
|---|---|---|
| 1. Goals | You write down the questions you want to answer | A short list of measurable goals |
| 2. Sources and method | You choose between already published data, surveys, interviews or observation | A research plan |
| 3. Sample and questionnaire | You decide who to ask, how many people and what | The questionnaire and the list of people |
| 4. Data collection | You send out the survey, carry out the interviews and gather the data | Organized answers and figures |
| 5. Analysis | You clean the data and look for patterns | Findings backed by numbers |
| 6. Conclusions and action | You decide what changes in your product, pricing or messaging | An action plan with KPIs |
Market research is a systematic process of collecting, analyzing and interpreting information about a specific market.
It covers consumers, competitors and the economic environment.
Its purpose is to reduce uncertainty and support business decisions.
You’ll also see it called marketing research or market study. In practice, they’re the same thing.
In practical terms, it involves:
Market research is not the same as a marketing plan. Research tells you what the market is like.
The marketing plan decides what you’ll do with that information.
From market research to your first campaigns
Once you know what your customers want, tell them by email. Create your free Mailrelay account.
Good market research turns assumptions into certainties.
By knowing how many people need your offer, how much they’re willing to pay and which alternatives they value, you keep blind decisions to a minimum.
That numerical backing lets you put your resources where the return is highest.
And drop early on ideas that look good on paper but don’t have enough demand.
Research also uncovers trends and competitive gaps.
Maybe you spot a segment that feels nobody is talking to it, or a sales channel that is still underused.
It’s especially useful at these moments:
| When | Question it answers |
|---|---|
| Before starting a business | Are there enough customers for the business to be viable? |
| Before launching a product | Do they want it, how much would they pay and what do they expect from it? |
| When setting or changing prices | What price does your customer accept and what do your competitors charge? |
| When entering a new area or country | What is that market like and who competes in it? |
| When sales drop | Has the customer, the competition or the industry changed? |
All of this results in customers who feel the offer was made for them.
That raises their satisfaction and loyalty and, by extension, the business’s profitability.
Types of market research are classified by data source, approach, goal and frequency. This table sums them up:
| Criterion | Type | What it is | Example |
|---|---|---|---|
| Source | Primary or field research | You generate new information | A survey of your customers |
| Source | Secondary or desk research | You use already published data | Statistics from the INE (Spain’s National Statistics Institute) |
| Focus | Qualitative | You understand motivations and perceptions | In-depth interviews or focus groups |
| Focus | Quantitative | You measure size and volume with representative samples | A structured survey of 400 people |
| Goal | Exploratory | You detect problems or opportunities when you know little | Interviews with 10 customers |
| Goal | Descriptive | You describe the market, its size and its behavior | Profile of your buyers |
| Goal | Causal or experimental | You check whether a change causes an effect | Two prices in two groups |
| Frequency | Continuous | You measure on a regular basis | A satisfaction survey every quarter |
| Frequency | Ad hoc or one-off | A study for a specific decision | Before opening a store |
There are other useful types. Emotional research looks for the psychological reasons behind a purchase.
Mystery shopping evaluates the shopping experience by posing as a customer.
And an expert panel interviews specialists when the end consumer is hard to reach.
In practice, several are combined. An exploratory phase to understand, a quantitative one to measure the potential and a test to validate before launch.
Here are the 6 steps in more detail. For each one you’ll see what to do and the mistakes to avoid.
What decision will you make with this market research? Start there.
Your goals guide the whole process: which sources you use, who you ask and how you interpret the data.
A vague goal leads to market research that is useless for making decisions.
Compare these two. Vague: “Get to know our customers better”.
Useful: “Find out what percentage of our customers would buy a business English course at €49 a month, before March”.
El segundo es SMART: específico, medible, alcanzable, relevante y con fecha. Si tienes varios objetivos, ordénalos por importancia y por los recursos que tienes.
Three or four goals are enough for a first market research project.
With clear goals, decide where the data will come from.
Always start with secondary sources, because they’re free and fast.
Official statistics, industry reports and data on your competitors answer many questions without asking anyone.
Then use primary sources to fill in what you can’t find published.
Qualitative methods, such as focus groups or in-depth interviews, help you understand motivations and feelings.
Quantitative methods, such as surveys, give you figures to measure.
A good order is to interview a few customers to discover what to ask, and then measure with a survey of many.
The sample is the group of people you ask on behalf of your whole market. It has to resemble it.
How many responses do you need?
For a large market, the benchmark figure is about 385 responses. That gives you 95% confidence with a 5% margin of error.
| Margin of error (95% confidence) | Responses needed in a large market |
|---|---|
| 10 % | About 97 |
| 7 % | About 196 |
| 5 % | About 385 |
| 3 % | About 1,068 |
If your audience is small, you need fewer. And for exploratory research, 10 or 15 well-conducted interviews already give you a lot of information.
In the questionnaire, only ask what you’re going to use. Mix closed questions, which are easy to count, with a few open ones to discover what you didn’t expect.
To measure opinions, the Likert scale (from “strongly disagree” to “strongly agree”) is the easiest to analyze.
Data collection is the heart of market research. This is where you gather the information that will feed the analysis.
It can be an online survey, phone or video interviews, a focus group or direct observation.
Before sending the survey to everyone, run a pilot test with five to ten people.
That way you spot confusing questions before they spoil your results.
The three most common problems are: few responses, a sample that doesn’t resemble your market and questions that push towards an answer.
To overcome them, offer an incentive that makes answering worthwhile. Combine several channels to reach different profiles.
And check that no question suggests the answer.
Document how you collected the data and store it securely, in compliance with the GDPR.
Your subscriber list is also a research panel
Send your survey by email and measure the responses with Mailrelay.
Once the data is collected, it’s time to turn it into useful information.
First, clean it. Remove duplicates, correct errors and decide what to do with incomplete responses.
Then analyze it according to the type of data. For quantitative data, calculate percentages and averages and cross variables, such as age and accepted price.
For qualitative data, group the responses by theme and count how many times each one appears.
A spreadsheet is enough for most small business market research.
Finally, visualize it. A couple of clear charts communicate more than ten pages of tables.
This is where market research starts to create value.
Go back to the goals from step 1 and answer each one with the data.
For each finding, write down the decision it leads to. It could be a product tweak, a price change, a new segment or a different message.
Plan how you’ll put it into practice. Define the steps, the people responsible, the deadlines and the KPIs you’ll use to measure whether it works.
And repeat your market research from time to time. The market changes and your conclusions expire.
Many questions can be answered with data that is already published.
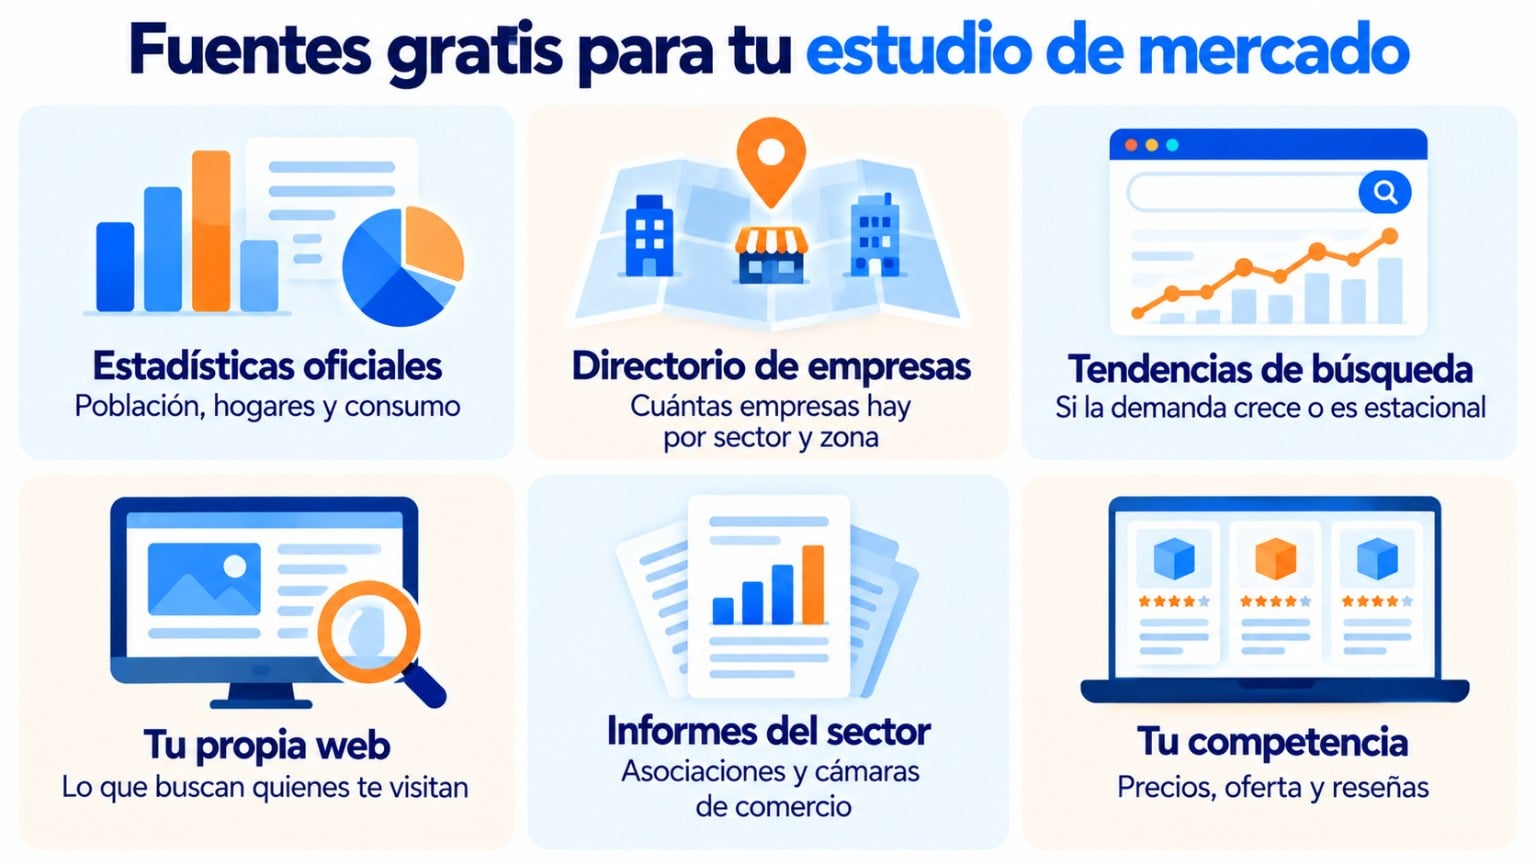
These are the free sources I use most for a first market research project in Spain:
| Source | What it gives you | What you use it for |
|---|---|---|
| INE (Spain’s National Statistics Institute) | Population, households, spending and consumption by area | Calculating the size of your market |
| INE’s DIRCE (Central Business Directory) | Number of companies by activity and province | Counting competitors or B2B customers |
| Eurostat | European Union statistics | Comparing countries before expanding |
| Google Trends | How interest in a topic evolves over time | Seeing whether demand is growing or seasonal |
| Google Search Console | What people who reach your website search for | Discovering needs in their own words |
| SEO tools with a free version | Search volume and competing websites | Measuring online demand |
| Industry reports | Data from associations and chambers of commerce | Keeping up with trends in your industry |
| Your competitors’ websites and reviews | Prices, offers and their customers’ complaints | Finding gaps nobody is filling |
To analyze your competitors’ websites, you’ll find more options in these free tools to analyze competitor traffic.
And to organize what you find, a SWOT analysis, a PESTEL analysis and Porter’s 5 forces will help.
So you don’t have to start from scratch, I’ve prepared a PDF template that you can fill in on your computer or print out.
It follows the 6 steps in this guide. It has space for the goals, the sources consulted, the sample and the questionnaire.
And also for the results, the conclusions and the action plan with KPIs. The last page is the language school example you’ll find below.
Market research template (free PDF)
Fill it in on your computer or print it out. It follows the 6 steps in this guide.
Let’s see how an online English school considering launching courses for companies would apply the 6 steps.
It’s a made-up example, but the sources and steps are real.
| Step | What the school does |
|---|---|
| 1. Goals | Find out whether its students work at interested companies, which format they prefer and what price they would accept |
| 2. Sources | It checks the DIRCE to count companies in its area and looks at interest in “English for companies” on Google Trends |
| 3. Sample | Its list of 2,400 subscribers. With about 330 responses it would have a 5% margin of error |
| 4. Collection | It sends an 8-question survey by email, with a prize draw for a free month among those who respond |
| 5. Analysis | It receives 410 responses. 38% work at a company that pays for training, and the preferred format is group classes during working hours |
| 6. Action | It launches a pilot with two companies, at a price below the limit set by most of the responses |
Look at step 3. The school didn’t buy any database or hire a panel. It used the subscriber list it already had.
It’s the cheapest and fastest way to do market research if you already have customers.
If you have a subscriber list, you have a free research panel.
The people answering already know you and have given you permission to write to them.
Here’s how to set it up.
Build the questionnaire in a form tool, such as Google Forms or Microsoft Forms.
Both are free and give you the results in a spreadsheet.
Then send your subscribers an email with the link to the form.
These questions give you a starting point:
What do you use our product or service for?
What problem were you trying to solve when you found us?
What other options did you consider before choosing us?
On a scale of 1 to 5, how likely would you be to buy [new product]?
What would you consider a reasonable price for [new product]?
What would you most like us to improve?
The email matters as much as the questionnaire. If it isn’t opened or isn’t convincing, there are no responses.
Say how long it takes to answer, what you’ll use the responses for and what respondents get in return. Include a single, clearly visible button.
Subject: Can you spare us 3 minutes?
Hi [name],
We’re preparing a new course and we want it to match what you need, not what we imagine.
It’s 8 questions and takes 3 minutes to answer. Everyone who answers before Friday will be entered into a draw for a free month.
[Take the survey]
Thanks for helping us improve.
If you only need one answer, you don’t need a form.
Put several options in the email, each with a different link to a thank-you page. For example: “Which format do you prefer?
Online / In person / Blended”.
Each click counts as a vote. Then you see the result in the campaign statistics, under clicks per link.
It’s the survey with the most responses, because it only asks for one click.
Explain what you’ll use the responses for and only ask for the data you need.
If you’re not going to match the responses to each customer, make it anonymous.
And don’t make surveys a habit. One or two a year are enough to keep your subscribers responding.
A well-designed survey isn’t only useful for market research. It also tells you what each subscriber is interested in.
If you store those responses in your subscribers’ fields, you’ll be able to create segments and send each group what it’s interested in.
This is data the customer gives you voluntarily, known as zero-party data.
If you launch your product without market research, you’re exposed to the risks found among the marketing challenges for businesses:
Big brands also make decisions based on data. These three cases show how knowing your customer changes a product.
The Wii U was a commercial flop for Nintendo: it sold 13.56 million units worldwide, according to the company’s official figures.
Its successor bet on something players were asking for: a single console to play on the TV and on the go.
The Nintendo Switch has sold 156.59 million units, according to Nintendo (figures as of June 30, 2026).
The lesson is to listen to what went wrong before launching the next thing.
Netflix measures what each subscriber watches and uses that data to decide what to invest in.
One of its findings is that a local series can succeed outside its home country if the story is universal.
Money Heist and Squid Game proved it.
According to Netflix, Squid Game racked up 1.65 billion hours viewed in its first 28 days, a record in 2021.
According to the brand itself, Dyson spent six years and £24 million researching how to style hair without damaging it with extreme heat.
The result was the Airwrap, launched in October 2018. It was sold out for months in several countries.
In all three cases, knowing the customer made it possible to fine-tune the value proposition and launch with confidence that there were people willing to buy.
Your subscriber list is the cheapest data source you have. With Mailrelay you can send your survey email to your whole list or just to a segment.
You can read the results of one-click surveys in each campaign’s clicks per link, on both the free account and Enterprise.
You store what you learn in custom fields to create segments. And with an A/B test you find out which subject line gets the most responses.
The free account includes 80,000 emails a month and 20,000 contacts. If you need more, you’ll find the plans on the pricing page.
This data is easier to integrate when you have a good marketing information system and a well-defined buyer persona.
Turn what you’ve learned into segmented campaigns
Create segments with the data from your research and send each customer what interests them.
These are the questions that come up most often when someone is preparing their first market research project.
It’s a process for gathering and analyzing information about your customers, your competitors and your industry.
It helps you make decisions based on data: launching a product, setting a price or entering a new market.
Six: set the goals, choose the sources and method, prepare the sample and questionnaire, collect the data, analyze it and draw conclusions.
It depends on its scope.
Market research with free sources and an email survey of your own customers costs you little more than your time.
A study commissioned from an agency, with a panel and focus groups, costs considerably more.
For a large market, about 385 responses give a 5% margin of error with 95% confidence.
With about 100 you get a first idea, with a 10% margin of error.
Yes, and it’s the fastest way to do market research if you already have customers.
Send an email survey to your subscribers, as long as they’ve given you permission to write to them, and complement it with secondary sources.

Jose Argudo
CMO at Mailrelay. Writes about email marketing, copywriting and conversion for small businesses and entrepreneurs.