Bias: what it is, what it means, types and examples
Why we don't always see things as they are: what a bias is, the most common types and how they affect your decisions
A bias is a leaning or deviation that keeps a person, a piece of data or a study from reflecting reality neutrally. For example, paying attention only to the opinions that confirm what we already thought.
We all have biases. They influence what we buy, how we interpret a news story and the conclusions we draw from a report.
What does bias mean?
In its original sense, bias means slanting or oblique: fabric cut on the bias is cut diagonally. That is where the figurative sense comes from: a biased judgment doesn’t go straight, but leans to one side.
Today the word is used mainly in three fields:
| Field | What a bias is | Example |
|---|---|---|
| Psychology | A mental shortcut that distorts a judgment | Believing people who share our opinion more readily |
| Statistics | A systematic error in the data or the sample | Surveying only satisfied customers |
| Everyday language | Partiality or prejudice | “That article has a political bias” |
Synonyms for bias include inclination, partiality, tendency or prejudice, depending on the context. In Spanish, the word (sesgo) is spelled with an “s” and a “g”: “cesgo” and “sezgo” are misspellings.
What is a cognitive bias?
A cognitive bias is a systematic error in the way we think. The brain uses shortcuts, called heuristics, to decide quickly. They almost always work, but sometimes they lead us to the wrong conclusions.
Psychologists Amos Tversky and Daniel Kahneman studied them starting in 1974. Their work gave rise to behavioral economics and earned Kahneman the Nobel Prize in Economics in 2002.
If you want to see how they affect purchases, we explain it in our article on cognitive biases and their impact on sales.
Decide with data, not gut feelings
A/B test your emails and check what really works with your audience. Free for up to 80,000 emails a month.
Types of biases and examples
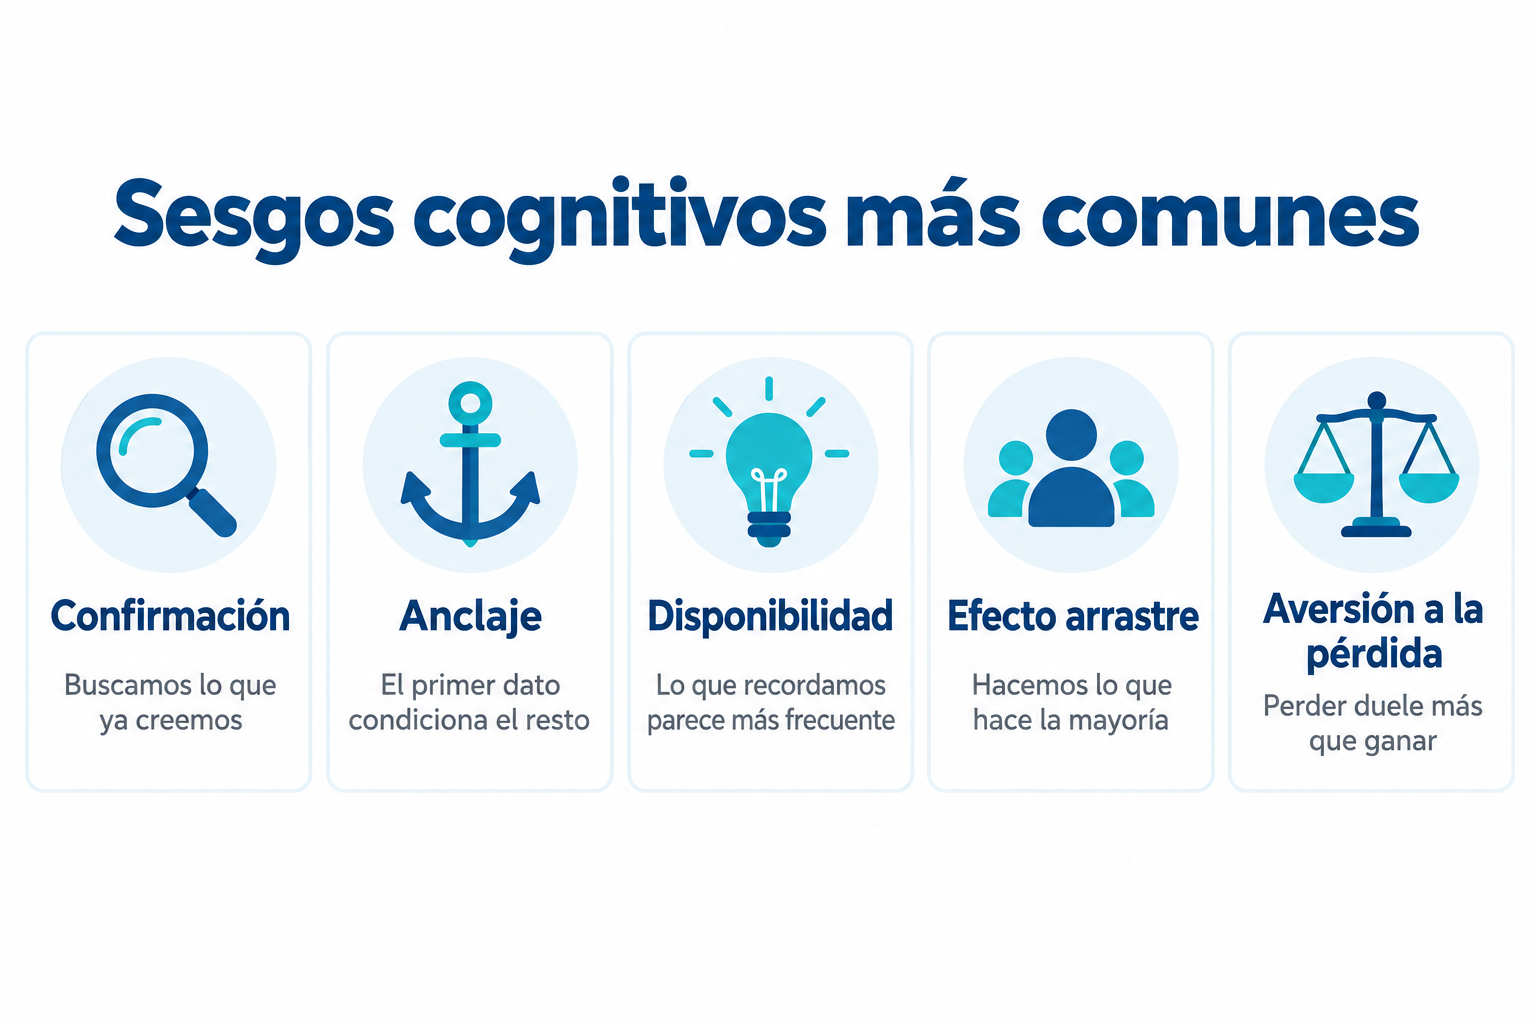
These are some of the best-known biases:
| Bias | What happens | Example |
|---|---|---|
| Confirmation bias | We look for what confirms what we already believe | Reading only positive reviews of the product we want |
| Anchoring bias | The first piece of information shapes everything else | A crossed-out price of €100 makes €60 seem cheap |
| Availability bias | What we remember easily seems more frequent | Overestimating a risk that has just been in the news |
| Bandwagon effect | We do what most people do | Choosing the restaurant that is full |
| Loss aversion | Losing hurts more than gaining the same amount | Reacting more to “don’t lose your discount” than to “win a discount” |
| Halo effect | One positive quality colors everything else | Thinking that a brand with good design is better at everything |
| Survivorship bias | We only see the cases that succeeded | Copying the companies that succeeded without looking at the ones that failed |
| Selection bias | The sample doesn’t represent the population | Drawing conclusions from a survey answered only by fans |
The last two are also statistical biases: they affect data, not just people.
Bias in statistics
In statistics, a bias is the systematic difference between what a study measures and reality. It is not a random error: it always repeats in the same direction.
It appears when the sample is poorly chosen, when a survey’s questions push toward a particular answer or when only the convenient data is analyzed.
Biases in marketing
Marketing uses biases to present an offer in a better light. This is the territory of neuromarketing and psychological triggers:
- Social proof: showing how many customers already trust you takes advantage of the bandwagon effect.
- Price anchoring: showing the original price next to the sale price.
- Scarcity and urgency: limited spots trigger loss aversion.
- Framing: “90% of customers come back” sounds better than “10% don’t come back”.
Using them is legitimate as long as the information is true. Inventing scarcity or a fake reference price deceives the customer and, in many cases, breaks consumer protection law.
Biases in email marketing
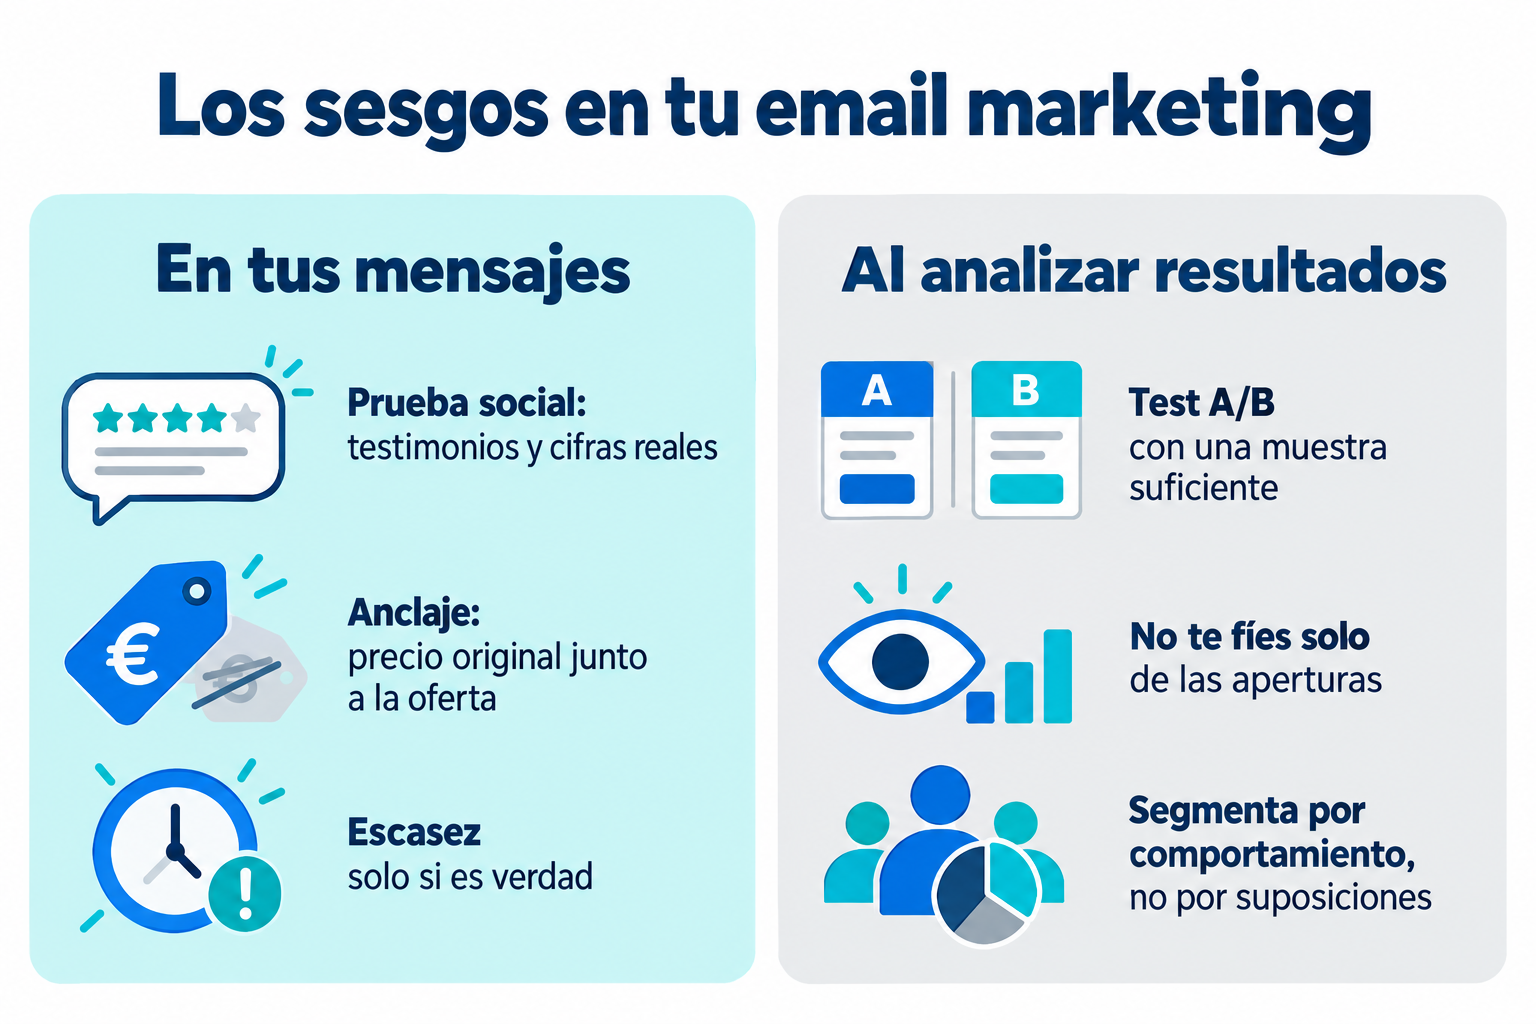
Biases affect your emails in two ways: in how your audience reads them and in how you interpret the results.
- In the subject line: a subject line that mentions what the subscriber could lose usually grabs more attention, but don’t overdo it.
- In the content: customer testimonials and figures work as social proof.
- When analyzing an A/B test: don’t declare a version the winner after only a few sends; wait until you have a large enough sample.
- When measuring opens: some email clients load images automatically, which can inflate the open rate. Look at clicks and conversions too.
- When segmenting: don’t assume what a group wants; check it against their behavior.
How Mailrelay helps you
With Mailrelay you can run A/B tests on subject lines and content, compare the results of your campaigns and segment your list based on what your subscribers do, not on what you think they will do.
The free account includes up to 80,000 emails a month and 20,000 contacts, with human support in English on all plans.
Measure what your subscribers do, not what you think they will do
Segment your list based on behavior and compare the results of every campaign. Human support in English.
Frequently asked questions about bias
These are the most common questions.
What is a bias in simple terms?
A leaning that makes us see or measure something in a partial way, without realizing it.
What does it mean to be biased?
That an opinion, a study or a set of data is not neutral and favors one conclusion.
What are the most common cognitive biases?
Confirmation bias, anchoring bias, availability bias, the bandwagon effect and loss aversion.
What is a bias in statistics?
A systematic error that makes a study’s results always deviate from reality in the same direction.
How do you avoid bias when analyzing data?
By using large, representative samples, defining your metrics before looking at the results and cross-checking with other sources.