Email marketing statistics 2026: reliable data and how to measure your own campaigns
How many people use email, what they expect from brands and how to measure your campaigns without relying on averages that aren’t yours
How many people use email, what they expect from brands and how to measure your campaigns without relying on averages that aren’t yours
Search for “email marketing statistics” and you’ll find figures for everything. Open rates by industry, returns of 40 euros for every euro invested, click percentages…
The problem is where they come from.
Many of these figures are published by companies that sell email sending. Others date from 2019 and are still shared as if they were new.
Here you’ll only find data from neutral sources: the INE, Eurostat, Radicati, the DMA, Litmus and the rules of Gmail, Yahoo and Outlook.
And for what no general statistic can tell you, you’ll see how to calculate your own metrics from your campaigns.
If you’re in a hurry, here are the email marketing statistics in this article, with their source and date.
| Data point | Figure | Source |
|---|---|---|
| Email users worldwide | 4.594 billion in 2025, 4.73 billion in 2026 | Radicati Group, 2024 |
| Email user forecast | 4.97 billion in 2028 | Radicati Group, 2024 |
| Spanish internet users who send or receive emails | 89,1 % | INE, 2025 |
| Spanish internet users who use instant messaging | 98,8 % | INE, 2025 |
| People in the EU who use the internet for email | 81,6 % | Eurostat, 2025 |
| People in Spain who bought online in the last 3 months | 59,6 % | INE, 2025 |
| Consumers who prefer email for receiving offers | 64 % | DMA (UK), 2023 |
| Opens recorded in Apple Mail | 76,56 % | Litmus, September 2026 |
| Opens recorded in Gmail | 16,10 % | Litmus, September 2026 |
| Daily sending volume above which Gmail and Outlook add requirements | 5.000 | Google and Microsoft |
| Maximum spam rate Gmail tolerates | 0,3 % | |
| Deadline for processing an unsubscribe in Gmail and Yahoo | 2 days | Google and Yahoo |
Below you’ll find each figure explained, along with what it means for your campaigns.
Email is still one of the channels with the widest reach there is.
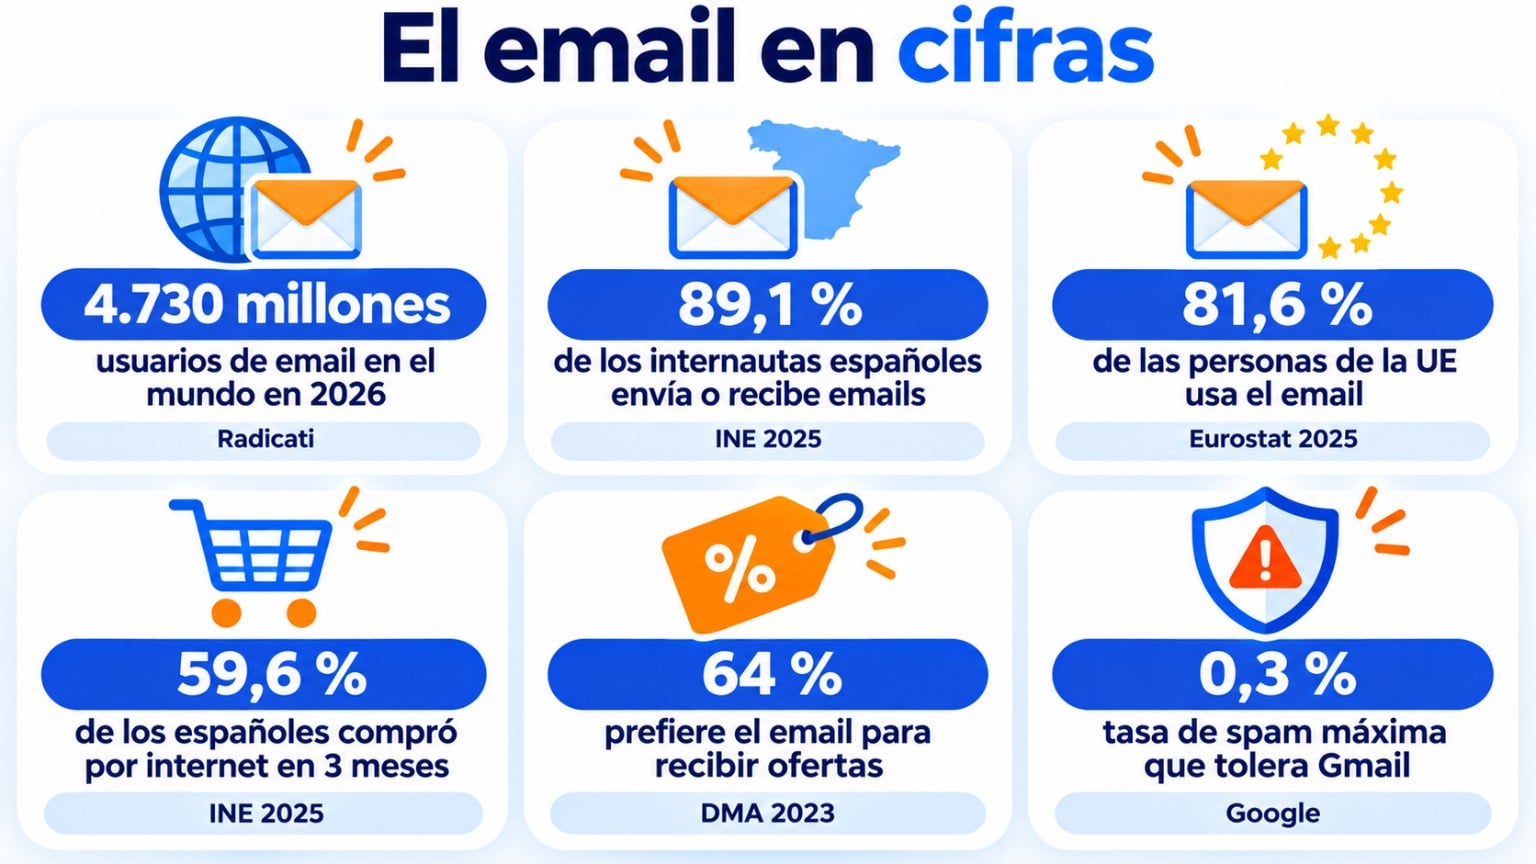
According to Radicati Group, there were 4.594 billion email users worldwide in 2025.
It estimates 4.73 billion for 2026 and close to 4.97 billion for 2028.
That’s more than half the world’s population with an active email address.
In Spain, the INE’s ICT household survey for 2025 gives a first figure: 96.3% of people aged 16 to 74 used the internet in the last three months.
Of those internet users, 89.1% sent or received emails. In 2024 it was 91%.
Instant messaging, such as WhatsApp, reaches 98.8%. And video calls, 82.9%.
In the European Union, according to Eurostat, 81.6% of people used the internet to send or receive emails in 2025.
What do these email marketing statistics tell us? That almost all your customers have an email address and check it.
Email doesn’t compete with WhatsApp for day-to-day attention.
It’s where people receive invoices, orders, bank notifications and news from the brands they’ve chosen.
That’s why, for a brand, it’s an owned channel: the contact list is yours and doesn’t depend on an algorithm.
The DMA is the UK’s direct marketing association.
In its 2023 Consumer Email Tracker, it asked more than 2,000 consumers about brand emails.
Email came first among marketing channels for three types of message:
It’s a UK study, but the pattern matches what we see in Spain. People accept commercial emails when they get something out of them.
There’s another INE figure worth keeping in mind. 59.6% of Spaniards aged 16 to 74 bought something online in the last three months.
Each of those purchases generates confirmation and shipping emails and, often, abandoned cart emails.
Email is present throughout the entire buying process.
Litmus, an email testing tool, publishes every month which email clients record the most opens.
In September 2026, based on 1.5 billion opens, the breakdown was as follows:
| Email client | Share of opens |
|---|---|
| Apple Mail (iPhone, iPad and Mac) | 76,56 % |
| Gmail | 16,10 % |
| Outlook (desktop) | 3,48 % |
| Yahoo Mail | 2,35 % |
| Google Android | 0,94 % |
Be careful how you read this table.
Apple Mail ranks so high partly because its privacy feature records opens that don’t always come from a person.
You’ll see why in the next section.
Even so, the data leaves a practical takeaway: a large share of your emails will be read on a phone.
Design for small screens and test your campaigns in Apple Mail and Gmail before sending them.
For years, the open rate was the star metric of email marketing. Today it’s only a rough indicator.
The reason is Apple Mail Privacy Protection, which Apple introduced in September 2021 with iOS 15.
When a user turns it on, Apple downloads the email’s images to its servers, even if the person doesn’t open it.
And the open is counted anyway.
According to Litmus, this feature affects between 55% and 60% of the opens it records.
Its recommendation is to measure clicks and conversions instead of opens.
On top of that, many companies block image downloads for security reasons, so a real open isn’t recorded.
So the open rate can come out inflated for one list and deflated for another.
Comparing yours with a published average doesn’t tell you much.
These are the metrics that do reflect what your audience does:
Measure the clicks, bounces and unsubscribes of every campaign
Mailrelay’s reports show you what works on your list, without relying on other people’s averages.
Some of the most useful email marketing statistics aren’t surveys, but rules.
Since February 2024, Gmail and Yahoo have set extra requirements for senders who send many emails a day to their users.
Microsoft did the same for Outlook.com and Hotmail from May 5, 2025.
| Requirement | Gmail | Yahoo | Outlook.com |
|---|---|---|---|
| Sending threshold | More than 5,000 a day | High volume (no published figure) | More than 5,000 a day |
| Authentication | SPF, DKIM and DMARC | SPF, DKIM and DMARC | SPF, DKIM and aligned DMARC |
| Spam rate | Below 0.3% (ideally below 0.1%) | Below 0.3% | No published figure |
| One-click unsubscribe | Mandatory in marketing emails | Mandatory | Recommended |
| Deadline to process an unsubscribe | 2 days | 2 days | No published figure |
Gmail’s sender guidelines add a warning: since November 2025, emails that don’t comply face delays and temporary or permanent rejections.
Microsoft also rejects messages that fail authentication, with error 550 5.7.515.
If you want the details of each requirement, you’ll find them in what Outlook, Gmail and Yahoo require to keep your emails out of spam.
For the technical side, check how to set up SPF, DKIM and DMARC with your domain. You can monitor your spam rate in Google Postmaster Tools.
No general average will tell you whether your last campaign was good. The email marketing statistics that really help you are your own.
For that you need your own numbers, always calculated the same way.
These are the basic formulas:
| Metric | How it’s calculated | What it tells you |
|---|---|---|
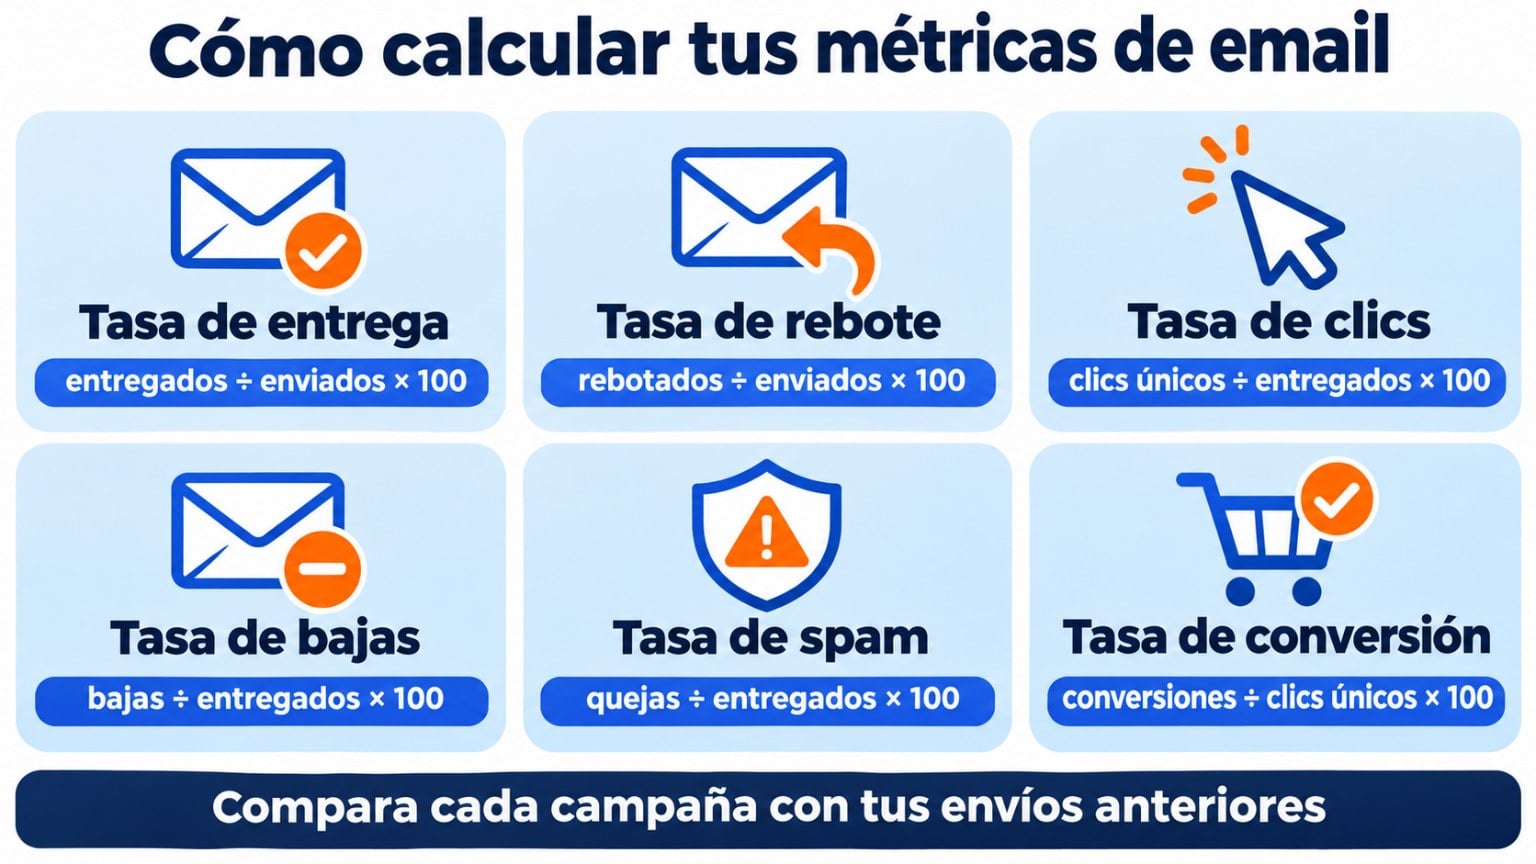
| Delivery rate | Delivered emails ÷ sent emails × 100 | Whether your list and your domain are healthy |
| Bounce rate | Bounced emails ÷ sent emails × 100 | How many addresses fail |
| Open rate | Unique opens ÷ delivered emails × 100 | A rough indicator, because of Apple’s privacy feature |
| Click-through rate (CTR) | Unique clicks ÷ delivered emails × 100 | How many people take action |
| CTOR | Unique clicks ÷ unique opens × 100 | Whether the content convinces those who open |
| Unsubscribe rate | Unsubscribes ÷ delivered emails × 100 | Whether your sends are tiring people or don’t fit |
| Spam rate | Spam complaints ÷ delivered emails × 100 | The figure Gmail and Yahoo watch most closely |
| Conversion rate | Conversions ÷ unique clicks × 100 | Whether the email brings business results |
Here’s an example with round numbers. You send 10,000 emails, 150 bounce and 9,850 are delivered.
If 400 people click, your click-through rate is 4.06%.
If 20 of them buy, your conversion rate is 5%.
With 15 unsubscribes, your unsubscribe rate is 0.15%.
And with 3 spam complaints, your spam rate is 0.03%, well below Gmail’s 0.3% limit.
ROI measures what you earn compared with what you spend:
ROI = (revenue attributed to email − email cost) ÷ email cost × 100
In the cost, include the tool, your team’s time and the design.
In the revenue, include only the sales you can attribute to email, for example with links tagged with UTM parameters.
In 2019, the DMA estimated a return of just over £42 for every £1 invested in the UK.
It was an average reported by the marketers themselves. Take it as a reference, not a promise.
You’ll only know your real ROI by measuring it with your own campaigns.
Your own statistics, from the very first send
Create your free account and compare each campaign with the previous ones.
You’ve surely seen tables with the average open rate for each industry. You may even have compared yourself with them.
Before you do, think about three things:
That’s why we don’t include industry averages in these email marketing statistics.
The comparison that does work is with yourself. This month’s campaign against the previous ones, with the same list and the same way of measuring.
In Mailrelay you can see this data for every send.
We explain it in what each sending statistics report measures and in real-time mailing statistics.
With the general data and your own, you can work like this:
If you need ideas to test, start with the subject lines that work best and the best time to send your emails.
And if you’re just starting out, there’s a complete guide on what email marketing is and how to get results.
These are the most common questions about email figures.
There’s no single figure that works for everyone. Apple Mail’s privacy feature inflates opens, and every tool counts them in its own way.
Compare your rate with that of your previous campaigns and pay more attention to clicks.
According to Radicati Group, about 4.594 billion people in 2025 and about 4.73 billion in 2026.
It forecasts close to 4.97 billion by 2028.
According to the INE, 89.1% of internet users aged 16 to 74 sent or received emails in 2025.
And 96.3% of people in that age group used the internet in the last three months.
Both require the spam complaint rate to stay below 0.3%. Gmail recommends staying below 0.1%.
Check each campaign 24 to 72 hours after sending, when most of the clicks have come in.
Once a month, compare your averages with those of previous months.
Start measuring your campaigns today
Create your free account and send up to 80,000 emails a month, with reports for every send.

Jose Argudo
CMO at Mailrelay. Writes about email marketing, copywriting and conversion for SMEs and entrepreneurs.
Comments are closed.
Great statistics. Thanks for sharing.